Problems can strike anytime at your facility – are you equipped to solve them?
In any industry, problems don’t wait for an invitation—they emerge unexpectedly, disrupting workflows, quality standards, and even safety protocols. Whether it’s a recurring defect in a manufacturing line, a compliance issue, or a system failure, organizations need structured problem-solving mechanisms to address root causes effectively. However, not all problems are created equal, and neither are the tools used to solve them.
Choosing the right problem-solving tool can mean the difference between quick fixes that fail and lasting solutions that drive continuous improvement. This guide breaks down three essential methodologies—5-Whys, Fishbone Diagrams, and Fault Tree Analysis—outlining their unique strengths and the best scenarios for their use.
I. 5 Whys Analysis: The Fastest Route to Root Causes
What is the 5 Whys Methodology
The 5-Whys technique is a straightforward problem-solving approach that helps teams drill down to the root cause by repeatedly asking “Why?” until they uncover the fundamental issue. Originally part of Lean and Six Sigma methodologies, this tool is best for simple or moderately complex problems that don’t require statistical analysis.
When to Use It
- When troubleshooting recurring, human-driven issues.
- When needing a quick and cost-effective problem analysis.
- When working in an environment where speed and simplicity are key.
How to Implement the 5 Whys
- Clearly define the problem – Identify and document the issue concisely.
- Ask “Why?” repeatedly – Each answer should lead to another “Why?” until the root cause is evident.
- Stop when a root cause is identified – Typically, five rounds of questioning are enough.
- Develop corrective actions – Once the root cause is found, implement solutions to prevent recurrence.
Key Benefits
✔ Simple and quick to execute
✔ Requires no specialized tools
✔ Encourages collaboration and deeper understanding
II. Fishbone Diagram: Structuring Cause-and-Effect Relationships
What Is a Fishbone Diagram?
Also known as an Ishikawa Diagram or Cause-and-Effect Diagram, the Fishbone Diagram is a visual tool that organizes potential causes of a problem into categories. It helps teams see contributing factors systematically and is particularly useful when multiple variables might be causing an issue.
When to Use It
- When multiple possible causes need to be explored.
- When team brainstorming and structured problem analysis are required.
- When a problem’s contributing factors span different domains (e.g., People, Process, Equipment).
How to Implement a Fishbone Diagram
- Define the problem – Clearly state the issue at the “head” of the diagram.
- Identify key categories – Common categories include People, Methods, Machines, Materials, Measurements, and Environment.
- Brainstorm potential causes – Add branches for each possible cause within the main categories.
- Analyze and refine – Discuss the diagram with the team, grouping similar causes and prioritizing key contributors.
Key Benefits
✔ Provides a structured and comprehensive analysis
✔ Encourages team collaboration and diverse perspectives
✔ Helps visualize relationships between factors affecting the problem
III. Fault Tree Analysis (FTA): A Systematic Approach for Complex Failures
What Is Fault Tree Analysis?
Fault Tree Analysis (FTA) is a top-down, systematic method used primarily in high-risk industries like aerospace, healthcare, and manufacturing. It maps out failures logically using a tree diagram, starting with an undesired event and tracing all contributing factors.
When to Use It
- When investigating complex, system-level failures.
- When needing a structured, logic-based approach to risk assessment.
- When compliance with stringent safety standards is required.
How to Implement FTA
- Define the undesired event – Clearly outline the failure that needs analysis.
- Develop the fault tree – Use logic gates (AND, OR) to represent relationships between contributing factors.
- Identify key failure causes – Break down the issue systematically into primary, secondary, and tertiary causes.
- Prioritize corrective actions – Focus on high-impact failure points and implement preventative measures.
Key Benefits
✔ Provides a clear visual representation of failure pathways
✔ Enhances safety and risk management practices
✔ Helps allocate resources effectively for preventive measures
Smart Problem-Solving Starts with the Right Tool
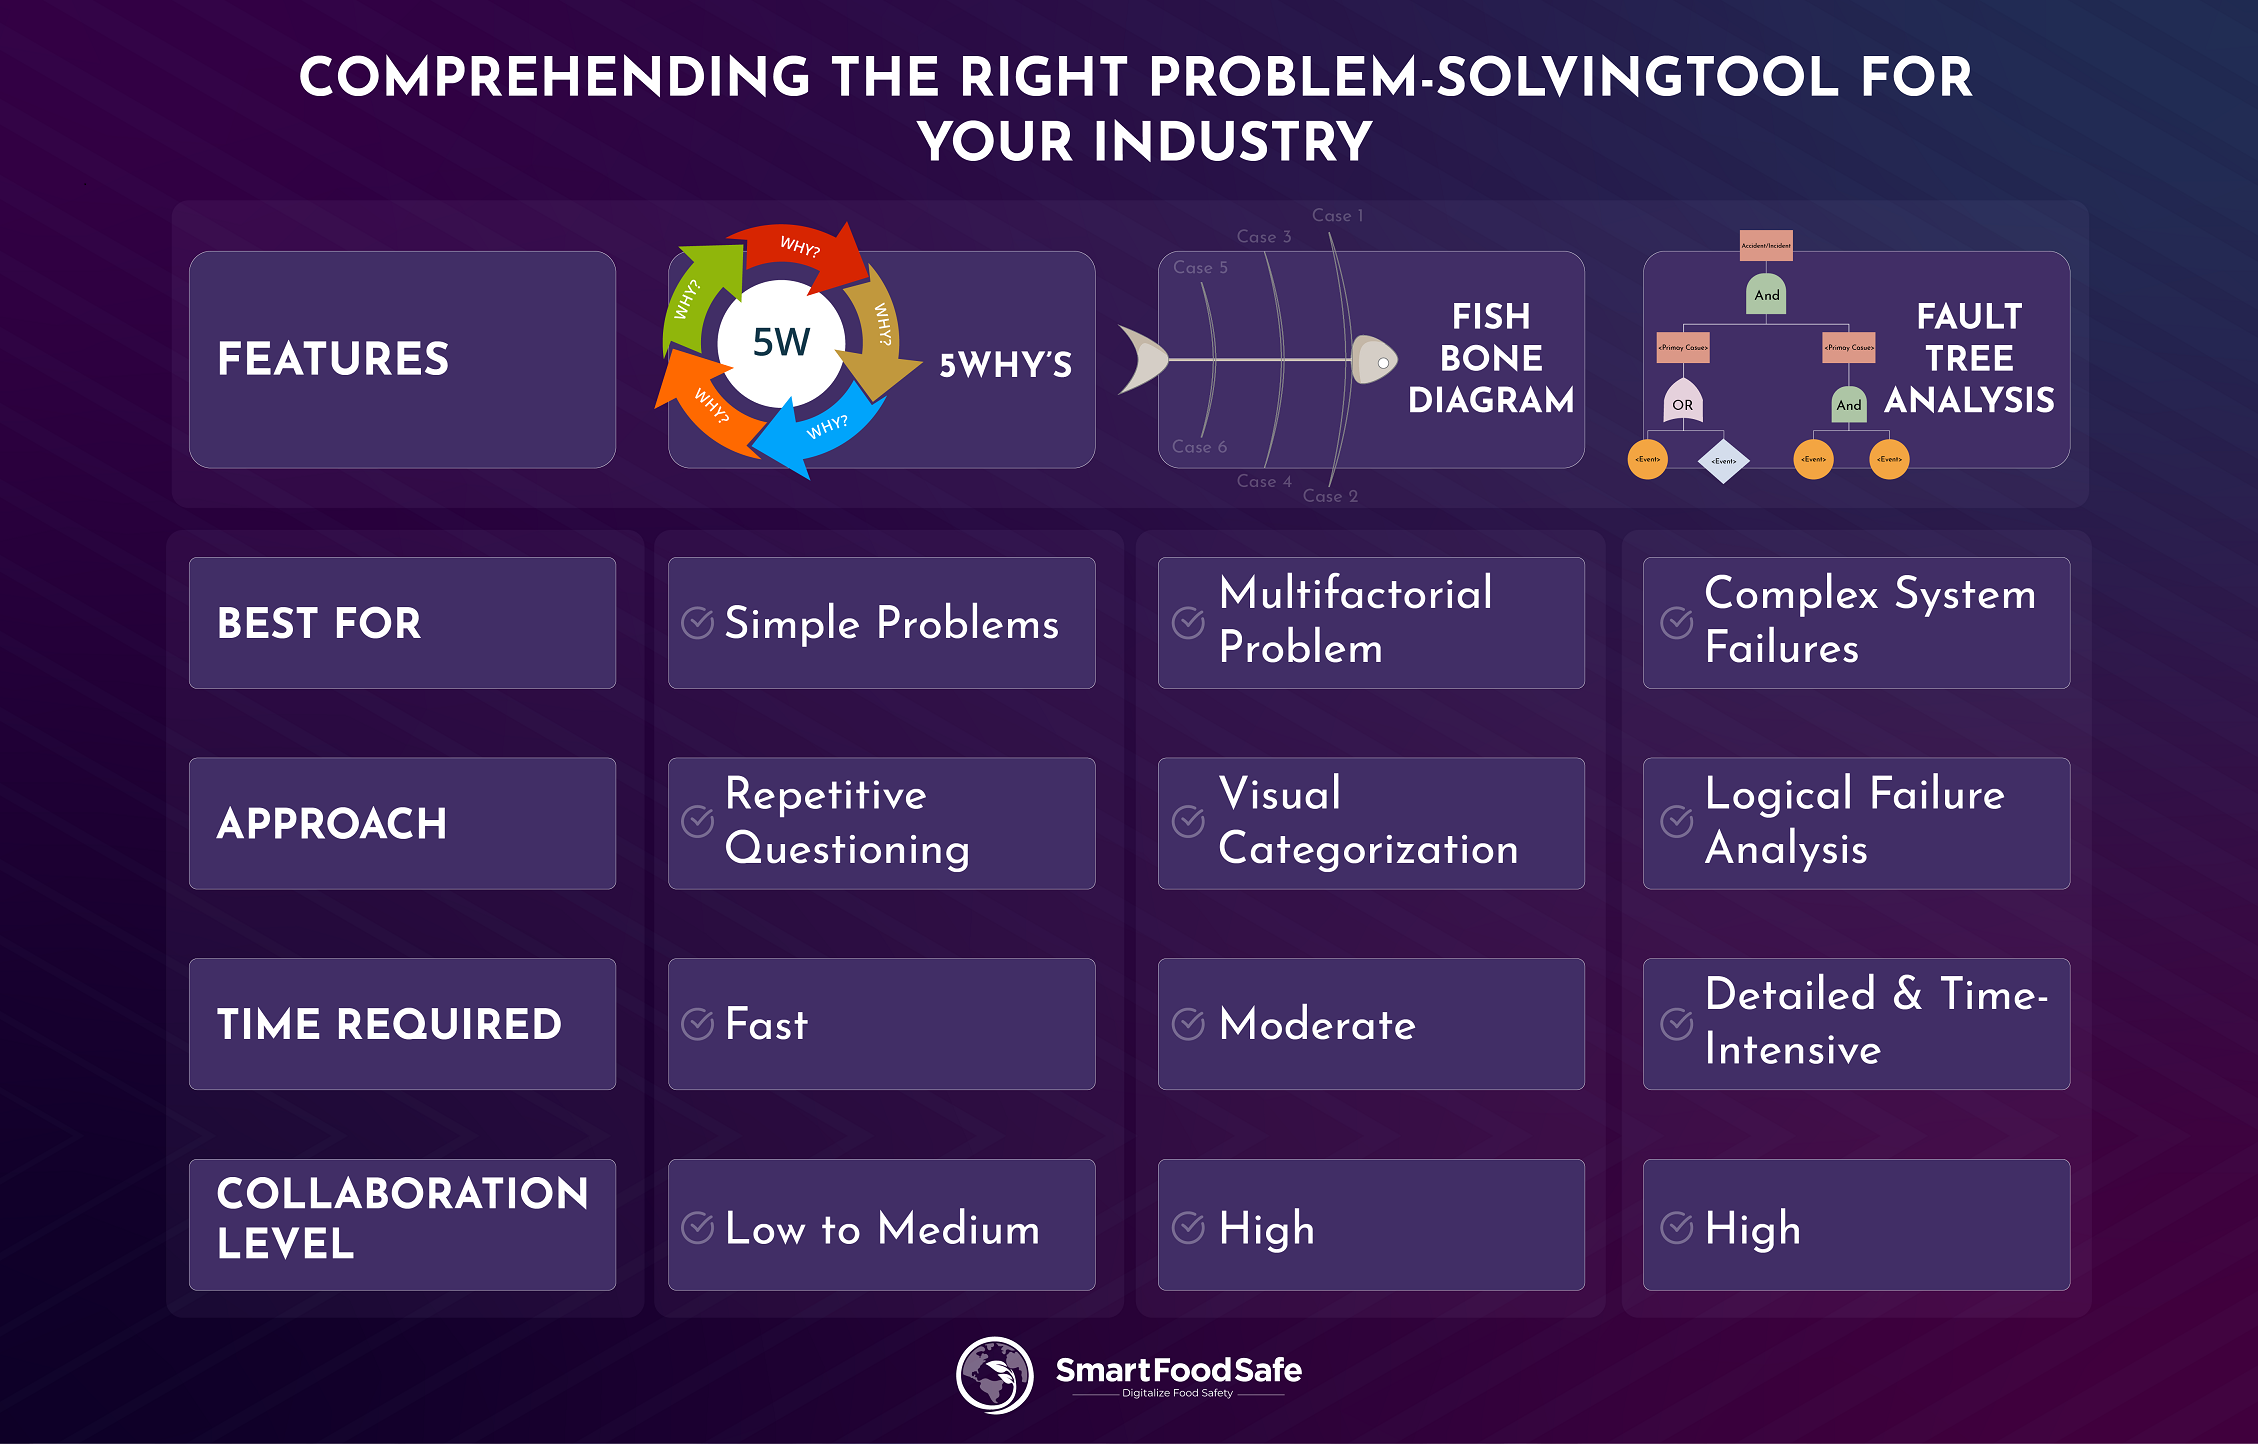
No single problem-solving tool fits all scenarios. While the 5 Whys is excellent for straightforward issues, the Fishbone Diagram helps teams structure complex cause-and-effect relationships. On the other hand, Fault Tree Analysis is essential when dealing with critical failures that require a highly structured investigation.
| Feature | 5-Whys | Fishbone Diagram | Fault Tree Analysis |
|---|---|---|---|
| Best for | Simple problems | Multifactorial problems | Complex system failures |
| Approach | Repetitive questioning | Visual categorization | Logical failure analysis |
| Time Required | Fast | Moderate | Detailed & time-intensive |
| Collaboration Level | Low to medium | High | High |
By selecting the right tool for the right situation, industries can enhance their quality management processes, reduce downtime, and drive ongoing optimization. The key to effective problem-solving isn’t just identifying problems—it’s choosing the right approach to solve them for good.
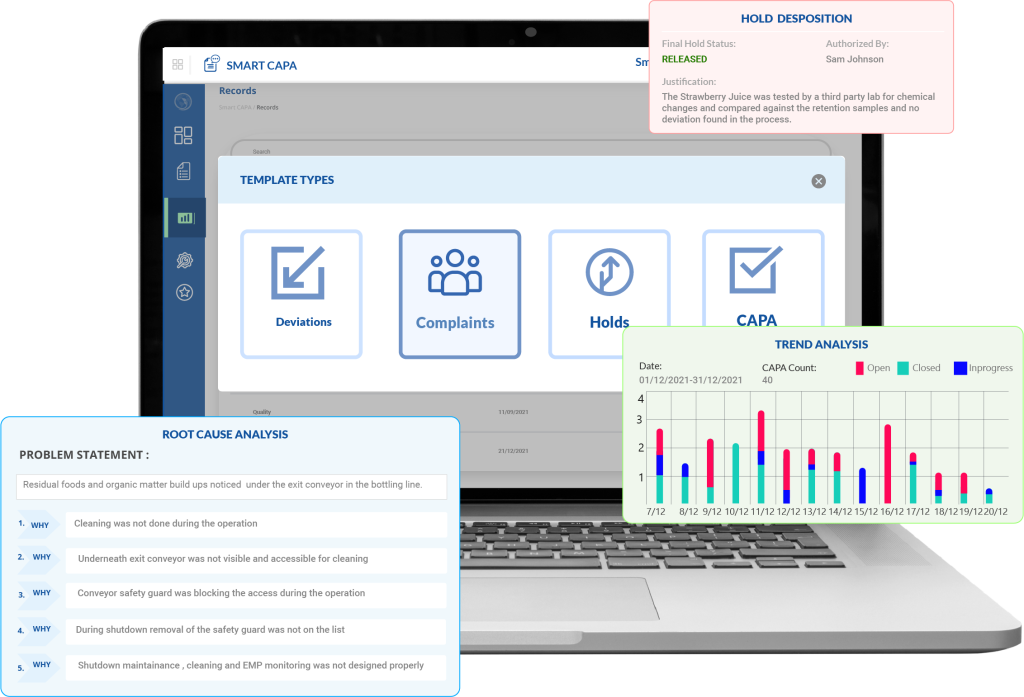
Lead the Way in Problem-Solving in Your Industry with Smart CAPA’s Digital Strategy
For organizations committed to dealing proactively with any issues as they emerge, integrating a systematized investigation and root cause analysis mechanism into their Corrective and Preventive Action (CAPA) plan will go a long way in the agenda.
Smart CAPA streamlines the entire investigation and root cause analysis process by embedding essential methodologies like 5-Whys, Fishbone Diagrams, and Fault Tree Analysis directly into its digital framework, enabling stakeholders to conduct their CAPA plan efficiently.
⇒ Structured Investigation Framework: This ensures all relevant data is systematically collected, analyzed, and documented to drive effective decision-making.
⇒ Integrated Root Cause Analysis Tools: Facilitates the use of 5-Whys and Fishbone Diagrams to identify core issues, helping businesses prevent recurring problems.
⇒ Documentary Evidence Management: Allows users to attach and manage reports, test results, and visual documentation to support investigations.
⇒ Root Cause Traceability: Links identified root causes to specific quality issues, providing an auditable connection that enhances accountability and compliance.
By leveraging these features, organizations can precisely identify, analyze, and eliminate quality issues while ensuring compliance with industry standards. With Smart CAPA, problem-solving isn’t just about fixing what’s broken—it’s about building a foundation for long-term operational excellence.